Research highlights 2020
The articles below are based on scientific articles and reflects our different research areas. They were originally published in the Bolin Centre’s annual report 2020
New global database aids researchers in mapping threats to wetlands
Wetlands cover only 4–9% of Earth’s land surface, but contribute to more than 20% of ecosystem services globally. They are also among the most vulnerable ecosystems on Earth, and are now under threat from both climate change and human activity. The impacts of such threats as well as different natural and manmade drivers influencing wetland conditions are not limited to just the local scale of each individual wetland, but extend over larger landscape areas that integrate multiple wetlands and their total hydrological catchment – the wetlandscape. However, our understanding of these interactions has been limited because data and knowledge of conditions and changes over entire wetlandscapes are still scarce. Bolin Centre researcher Navid Ghajarnia and co-authors have now developed a new global database that maps how these factors have changed at 27 wetlandscapes during a 30-year period. This new database makes it easier for researchers to study changes in wetlandscapes that are due to climate change and human activity.
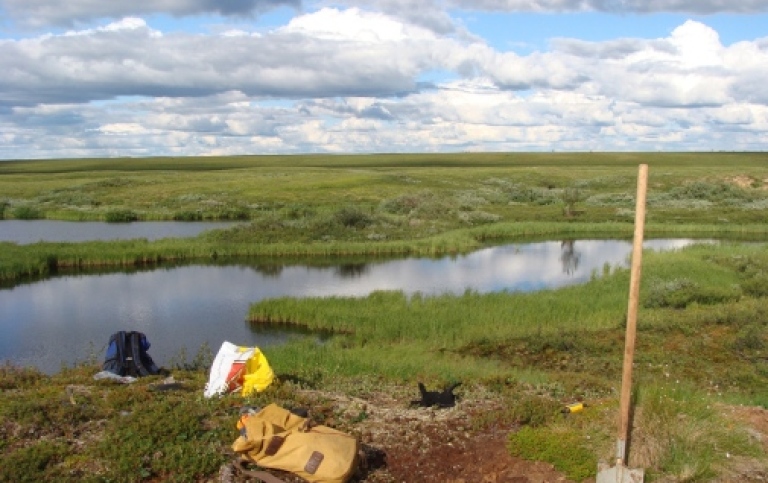
Ecosystems that are covered by water during various time periods, it could be permanently (years or decades) or seasonally (weeks or months), are called wetlands. These could be either marshes and ponds, areas at low altitudes that are flood-prone, or the delta at the mouth of a river. They serve many important functions in the Earth system, among them being water quality remediation, regulation of soil moisture and groundwater replenishment, biodiversity conservation and so forth. Wetlands also store large amounts of carbon in the form of peat.
However, they are also one of the most vulnerable ecosystems on our planet. Human activity such as the development of land and water use, as well as climate change and variability, are now resulting in rapid and continued decline in wetland areas all over the world. The term wetlandscapes are used in this study to refer to wetlands that are interconnected with the larger surrounding landscape, by for example the hydrological cycle. This is an important perspective to apply because human activity and climate change does not impact wetlands as isolated areas. Ghajarnia further explains “the combination of high wetland vulnerability and rapid large-scale changes subject to major knowledge and data gaps highlights the need to synthesize and create datasets available for evaluating change effects and feedbacks at the scales of whole wetlandscapes”.
WetCID – a new survey-based collection of local information and data about wetlands
Wanting to fill these knowledge and data gaps, a group of researchers came together to create a novel database, among them Bolin Centre researchers Gia Destouni, Josefin Thorslund, Zahra Kalantari, Imenne Åhlén, Fernando Jaramillo, Jerker Jarsjö, John Livsey, Britta K. Sannel, Samaneh Seifollahi, and Guillaume Vigouroux, in addition to lead author Navid Ghajarnia.
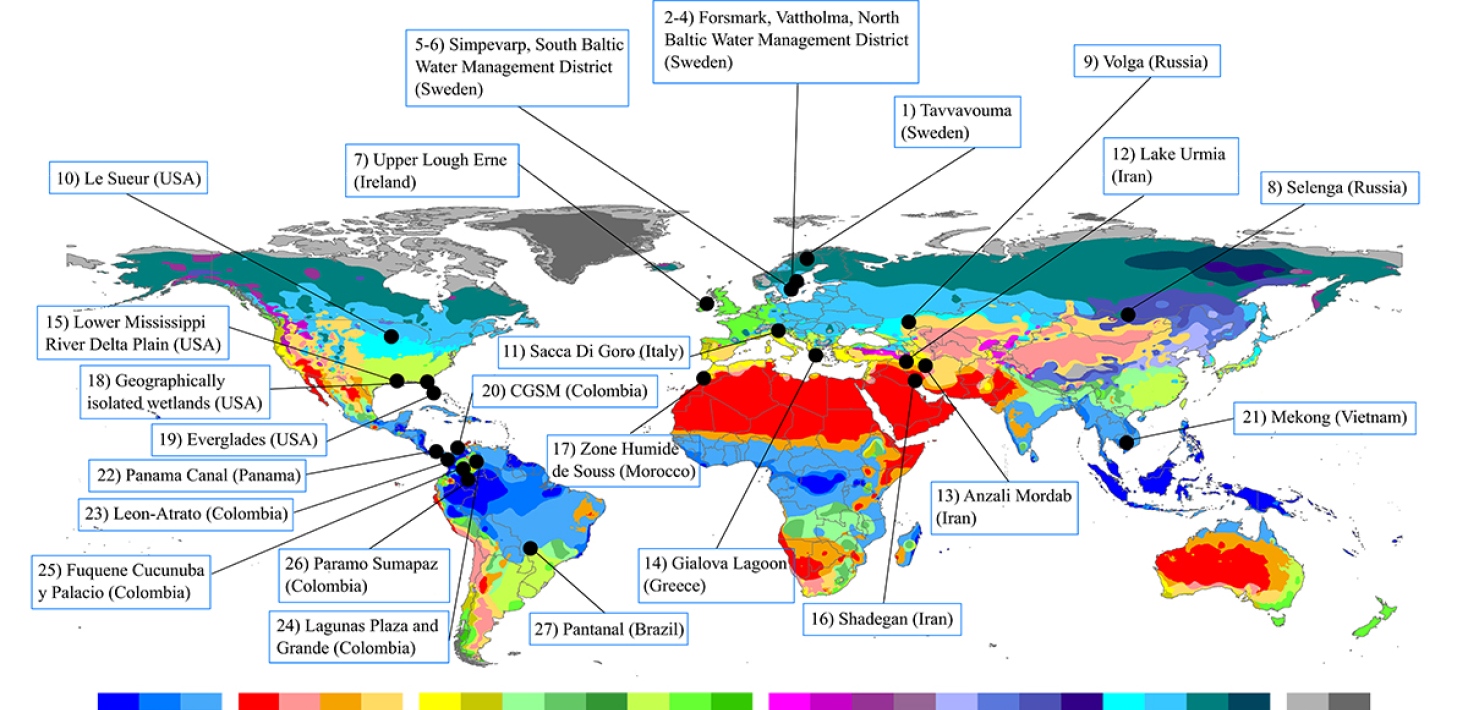
The database was named the Wetlandscape Change Information Database, WetCID for short, consisting of a survey-based collection of local information and data combined with gridded large-scale hydroclimate and land-use datasets. As seen in the figure, the database includes 27 wetlandscape sites around the world, and their associated geographical, wetland, hydrology, hydroclimate and land-use conditions. For each wetlandscape, there are gridded datasets representing 30-year time series of mean monthly rainfall, temperature, and annual averages for land uses and their changes.
This new database can support site assessments, cross-regional comparisons, and scenario analyses of the roles and impacts of various land-use, hydroclimatic, and wetland conditions as well as the associated changes on the functions and ecosystem services of wetlandscapes. WetCID will also make it easier for climate researchers to identify and map potential threats to wetlands caused by climate change and human activity. Another valuable function of the database is that the information gathered there can guide researchers in identifying additional information or data gaps that needs further attention.
Did this database, or the research leading up to it, reveal something about wetlands and wetlandscapes that you and your colleagues did not know before this study was initiated?
“An interesting aspect of this work is the inclusion of local information on wetland changes that are hardly available for non-local researcher from online and public sources. For example, we have the summary information about the most noticeable changes in water quality and quantity of the wetlands and wetland’s upstream hydrological catchments in the survey information forms, provided by local experts which is indeed valuable and unique data. Such information is normally not accessible to the public but WetCID makes it possible for international researchers to access these valuable information”, explains Ghajarnia.
Who can access this database, and what do you think its primary use will be for?
“The WetCID database is publicly available through the PANGAEA repository (https://doi.pangaea.de/10.1594/PANGAEA.907398). Everyone with any type of research, education, or even commercial interest can have free access to the database, but must provide appropriate credit and citation after usage. The primary usage of WetCID is to study hydro-climatological characteristics of wetlands in connection with their surrounding environment (wetlandscape) and also to investigate impacts of different climatic and anthropogenic drivers on long-term changes of wetland ecosystems”, says Ghajarnia
The article Data for wetlandscapes and their changes around the world was published in Earth System Science Data on May 13th, 2020. Access the full article here: https://essd.copernicus.org/articles/12/1083/2020

Navid Ghajarnia is a researcher at the Department of Physical Geography, Stockholm University. His research interests lie in global hydrology, water resources analysis, climate change, and data science.
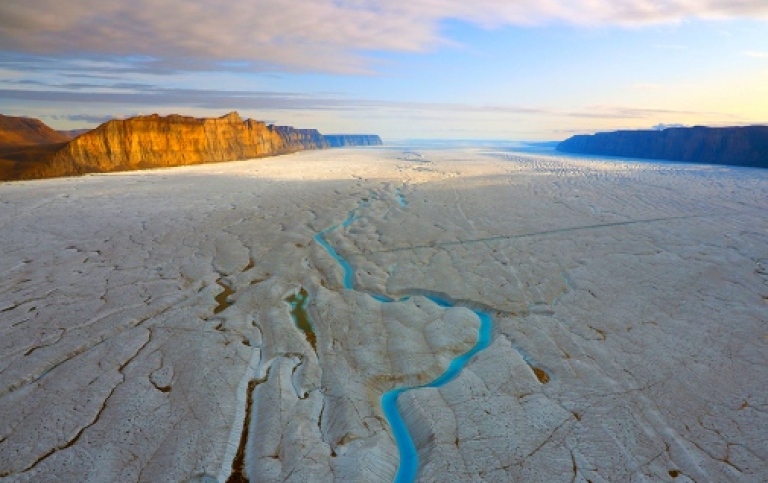
The shape of the seafloor restricts melting of Ryder Glacier in northwest Greenland
Glaciers and ice sheets around the world have been losing more than 700,000 Olympic swimming pools of water every day. Glaciers form by the transformation of snow into ice, which is later melted by the atmosphere in summer, or slides slowly all the way into the sea. With climate change, glaciers are melting and breaking up into icebergs, which feed into the ocean at an accelerating pace. Exactly how fast depends to a large extent on the shape of the seafloor and on the bed below all the ice. New bathymetric and oceanographic data collected by an international team of marine geoscientists provide important insights into the processes that are controlling the rapid loss of the Greenland Ice Sheet over the last four decades.
In 1997, the impact of inflowing warm water on glaciers with ice tongues stretching out in the sea was observed in western Greenland. The Jakobshavn Glacier thinned rapidly due to a sudden increase in subsurface temperature, associated with water inflows from the Irminger Sea near Iceland. When Jakobshavn Glacier lost nearly all of its ice tongue in the early 2000s, iceberg calving directly from the ice-cliff margin increased drastically. The shape of the seafloor has been suggested to play a vital role in this process. This is supported by a new study investigating the Ryder Glacier in North Greenland.
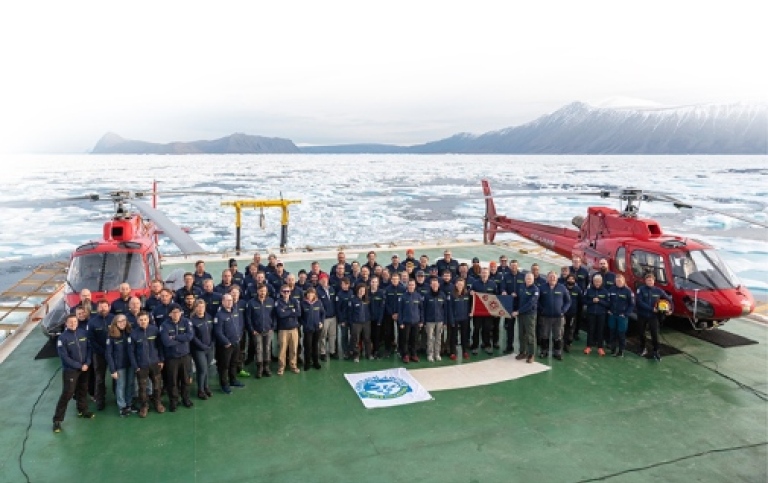
In late summer 2019, the Swedish icebreaker Oden ventured into the previously unmapped Sherard Osborn Fjord, where the Ryder Glacier drains into the Arctic Ocean. Melting and calving glaciers act as key catalysts for the increasing loss of ice sheet. Glaciers with their floating ice tongues buttress inland ice and help maintain the stability of the ice sheet. This controls the movement and velocity of the inland glacier. However, the more precise processes that controls the advance and retreat of outlet glaciers remain relatively unknown, limiting the ability to assess their fate and contribution to global sea-level rise.
After the data obtained in the two week Oden field campaign inside Sherard Osborn Fjord was analysed, it was revealed that warmer subsurface water of Atlantic origin enters the fjord, but Ryder Glacier’s floating shelf – at its present location – was partly protected from the inflow by a bathymetric sill located in the innermost fjord. In other words, the inflowing warmer water of Atlantic origin is partly prevented from reaching Ryder Glacier by the shape of the seafloor. This reduces under-ice melting of the glacier and provides insight into Ryder Glacier’s dynamics and its vulnerability to inflow of Atlantic warmer water. The data may also play a valuable role in undertaking assessments of the North Greenland Ice Sheet’s future retreat.
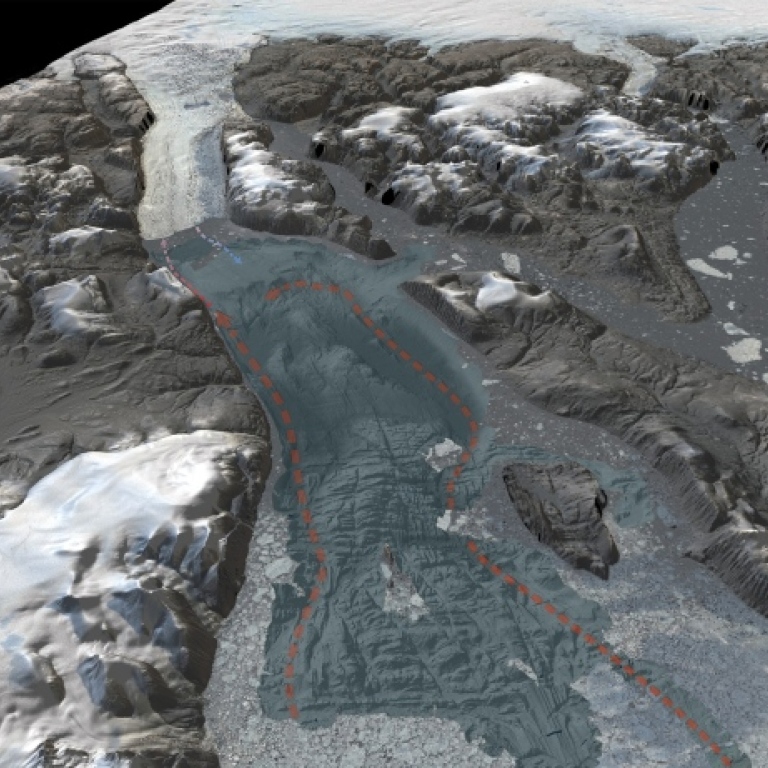
The researchers also compared the data with observations from another outlet glacier that discharge ice into the Arctic Ocean. The Petermann Glacier, with a bathymetric sill located more than 40 km from the current ice-tongue terminus and a maximum depth of 443 m, is far more exposed to inflow of warmer Atlantic Water than Ryder Glacier, which is protected by the inner sill in Sherard Osborn Fjord with a maximum depth of 390 m restricted to a narrow, 1 km wide channel.
“The data we have collected aboard Oden provides an important insight into why the future mass loss of the Greenland Ice Sheet is complicated to assess. It also highlights the necessity of having a complete map of the ocean floor,” comments Bolin Centre researcher Martin Jakobsson, Stockholm University.
The article Ryder Glacier in northwest Greenland is shielded from warm Atlantic water by a bathymetric sill was published in Nature’s Communications Earth & Environment on November 4, 2020. The article can be accessed here: https://doi.org/10.1038/s43247-020-00043-0.
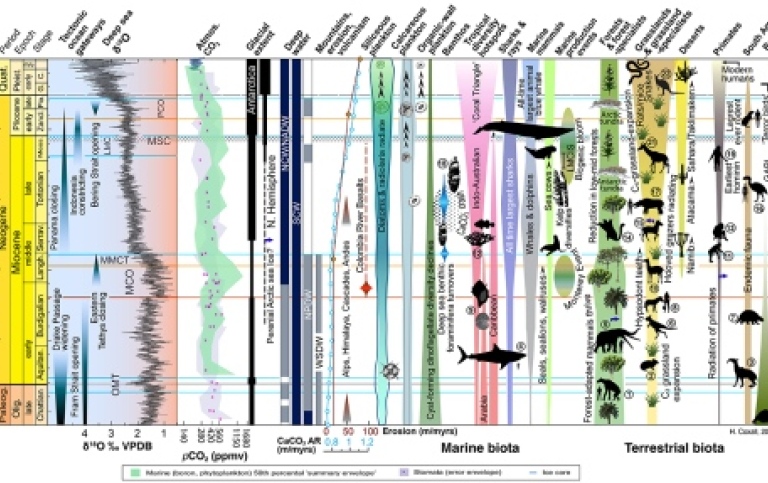
The Miocene: A climate window into the future
If we go back to a period ~23–5 million years in the past, we will find ourselves in the Miocene epoch. There, we find a world with significantly higher temperatures than today, while CO2 levels were just slightly higher than modern day levels. This can point to that relatively low, near future, CO2 levels can cause a larger warming of Earth’s systems than today’s climate models can reproduce. In their review paper, titled “The Miocene: The Future of the Past”, Bolin Centre researcher Margret Steinthorsdottir and co-authors use climate-reconstructions from the Miocene to test their knowledge about Earth’s systems under conditions where both temperatures and CO2 are higher than they are today. In this way, it gives us the rare opportunity to see into the future.
Earth’s climate consists of many systems that are both complex and intertwined, which means that a change to any part of the system can cause a series of other changes. This makes it hard to predict what climate change will do to our future Earth, and therefore, climate scientists have long been looking for a paleoclimate period to serve as an analogue for the future. Although much can be learned from studying any time period during Earth’s history, the best and most accurate findings will come from studying a period that holds most in common with the future climate state. In that way, one can better understand Earth’s vulnerable system components.
In a community effort to formally evaluate the Miocene as a future warm climate analogue, an international group of paleoceanographers, paleontologists, geologists and modellers came together at two workshops in Stockholm in 2018 and 2019. Among them were a group of Bolin Centre researchers; lead author Margret Steinthorsdottir, and co-authors Helen Coxall, Agatha de Boer, Natasha Barbolini, Steffen Kiel, and Thomas Mörs. The result was this review paper, The Miocene: The Future of the Past, and an associated special collection of papers published in Paleoceanography and Paleoclimatology.
While no past time period is the perfect analogue for the future, the authors found it likely that the equilibrium future climate state will bear more in common with the Miocene than with either the Pliocene (~5,3–2,58 million years ago) or the Eocene (~56–33,9 mya), other past warm epochs that have been suggested as future-climate analogues. In particular, the middle Miocene Climatic Optimum (MCO, ~17–14 mya) – a transient warming in the early–middle Miocene was identified as a potential strong near-future climate analogue. She explains that the aim is to “place what we know about the long term, broad-scale evolution of the global Miocene system in context of key scientific questions that are currently (at least partially) answered as well as those that remain unanswered to date”.
The knowns and unknowns of the Miocene
The Miocene epoch is a time period characterized by a highly variable climate that was around 5–8°C warmer, but seemingly at atmospheric CO2 levels not much higher than todays. There were no continental-sized ice sheets in the northern hemisphere, only on Antarctica. Much of the geography that we see today was shaped by the tectonic activity during this time period, and many plants and animals had evolved to near modern-day species at this point in time.
By the late Miocene, important subsystems of our modern Earth had evolved and stabilized, such as perennial Arctic sea ice, stronger monsoon systems, the tundra/permafrost biome, modern-type forests and deserts and their ecosystems, and so on. She explains: “that these Earth system components, many of which are now viewed as ‘vulnerable’ to anthropogenic (caused by humans) climate change, switched on at this time, implies they have their ‘tipping points’ in the Miocene temperature/CO2 zone”.
These findings concluded that the best available analogue for our future Earth affected by human caused climate change is the Miocene. Thus, many lessons can be learned by studying the Miocene. For example, models have forecasted that if global mean temperatures were to go up by 4°C, it would lead to the destabilization of critical climate subsystems. By studying the Miocene world, it could provide valuable insight into what our future climate could look like.
What significance does this review paper and its findings have for other fields in climate science?
“The review paper illustrates the enormous progress that can be made when a group of interdisciplinary scientists interested in a research question (here the many mysteries of the Miocene) work together towards a common goal. We make a strong argument that the Miocene represents a good future climate analogue and that studying this analogue raises some alarming issues, such as that CO2 concentrations not much higher than modern prevailed in the much hotter Miocene world. This may indicate that ‘climate sensitivity’ (the temperature rise per a given increase in CO2) may increase with rising temperatures. Of note is that the MCO has for the first time been included in the IPCC’s latest assessment report (6th, 2021) as a ‘Paleo reference period’ of a particular interest, citing the review paper”, explains Steinthordottir.
What’s the best approach moving forward?
“In addition to the review paper and associated special issue, collaborations initiated at the workshops have resulted in the development and launch of a Miocene Temperature Portal, hosted at the Bolin Centre for Climate Research. The portal collates a list of key information about published Miocene ocean temperature records, enabling researchers to rapidly locate and evaluate datasets relevant to the study of Miocene climate change, significantly simplifying the arduous process of collating these datasets. The portal presently includes ocean temperature records only, with plans to expand to terrestrial records in the near future. Other outputs in progress include the initiation of a Miocene Model Intercomparison Project (MioMIP), as well as the planning of a third workshop in Utrecht in 2022”, says Steinthordottir.
The article The Miocene: the Future of the Past was published in Paleoceanography and Paleoclimatology on 23 December 2020. Access to the full article: https://agupubs.onlinelibrary.wiley.com/doi/abs/10.1029/2020PA004037.

Margret Steinthorsdottir works as a researcher at the Museum of Natural History and is affiliated with the Department of Geological Sciences at Stockholm University. Margret is also one of the co-leaders for Research Area 6 Deep time climate variability. Her research focuses on the precise role of CO2 in climate change, and uses past climate change transitions as a “natural laboratory” to do so.
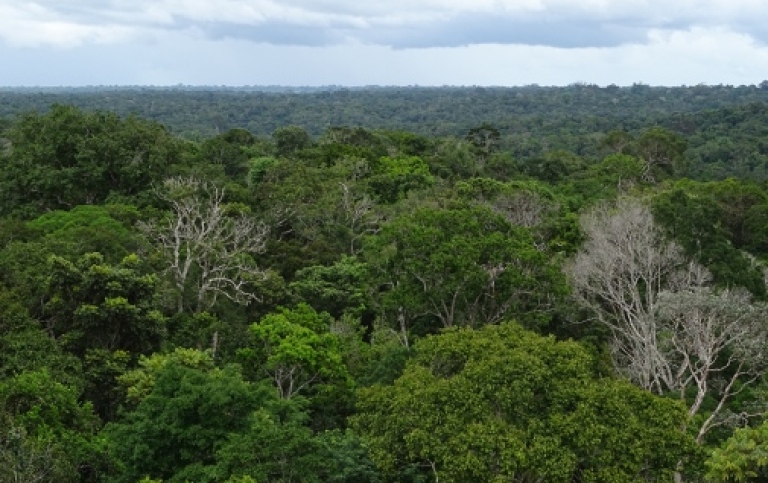
The future of tropical forests under climate change
Often called “the lungs of our planet”, tropical forests play a crucial role in global carbon storage and sequestration. They are some of the most varied environments on Earth, and are under threat from both deforestation and global warming. A study by Arie Staal and co-authors finds that with growing greenhouse gas emissions, there is a chance that a larger part of the Amazon rainforest loses its natural resilience and turns into a savannah-like ecosystem. It could take decades for tropical forests to recover from this, which could have devastating consequences for plants and animals.
Tropical forests are home to the majority of species on Earth, and the loss of them could have detrimental effects to the Earth system. Our tropical forests are also important regulators of the global climate; they mediate their regional climate by enhancing atmospheric moisture recycling, which in turn enhances rainfall levels at both seasonal and annual time scales.
Efforts to limit global warming and the effects of climate change have proposed reforestation and afforestation in the tropics as effective mitigation actions. Previous studies that have analyzed the potential of afforestation, have essentially acknowledged hysteresis in forest cover. The hysteresis of tropical forests, defined here as the difference in forest cover area between the two extremes, is shaped by feedbacks at different spatial scales. These feedbacks ultimately control tropical forests’ resilience to deforestation and response to climate change. However, these previous studies have not taken into consideration that potential forest distributions may change due to rainfall effects of afforestation itself or their interactions with global climate change. “By accounting for these factors, our analysis sheds more light on the forest potential across the tropics, though it is important to note that afforesting natural grassland and savannas may neither be a feasible nor desirable climate-change measure, and a number of other considerations, including biodiversity, would need to be accounted for”, explains Arie Staal.
Losing and gaining resilience under future climates
In this study, Arie Staal and his colleagues aim at finding out more about the tropical forest hysteresis that emerges from the combination of local-scale tipping points and regional feedback under current and future climates. These findings can help us better understand the role of tropical forests in the Earth system. Staal and colleagues focused on tropical rainforests in the Americas, Africa, Australasia; specifically, the Amazon rainforest, the Congo rainforest, and Asian rainforests. In assessing how the stability of tropical forests may change under climate change, they used rainfall projections by relying on remote sensing, a global hydrological model, and detailed atmospheric moisture tracking simulations.
What they found was that in areas stricken by drought or aridification due to climate change, some areas that are now forested may cross a tipping point and lose its forests with continuing global warming. This type of transition occurs mainly in the northern part of the Amazon rainforest. In Africa and Australasia, only a small portion of tropical forests might cross this tipping point. In areas where climate change has done the opposite, causing wetter conditions, some non-forested areas may cross a tipping point to a forested area. The areas that may experience this type of transition are more evenly distributed across the three continents, as one can observe in the figure below. Furthermore, Staal explains that “the Amazon forest could partially recover from complete deforestation, but may lose that resilience later this century. The Congo forest currently lacks resilience, but is predicted to gain it under climate change, whereas forests in Australasia are resilient under both current and future climates”.
How can the findings from this study aid in the efforts to try and limit global warming, like for example mitigation efforts?
“They illustrate not only the importance of halting tropical deforestation for climate-change mitigation, but also the importance of mitigation for maintaining resilient forests, especially in the Amazon”, says Staal.
What is a next step in your research to better understand the role of tropical forests in the Earth system?
“One weakness in this study that I plan to solve is that, although we accounted for future rainfall changes under severe climate change, we did not account for atmospheric circulation changes. This would improve our estimates of the future resilience of tropical forests. Next, I aim to use this information to assess where forest restoration efforts could benefit Earth’s tropical forests considering the enhancement of rainfall” explains Staal.
The article Hysteresis of tropical forests in the 21st century was published in Nature Communications on October 5th, 2020. Access the full article here: https://www.nature.com/articles/s41467-020-18728-7.
Arie Staal was formerly a Bolin Centre postdoctoral researcher at the Stockholm Resilience Centre. He now works as an Assistant Professor of Ecosystem Resilience at the Copernicus Institute of Sustainable Development, Utrecht University.
Abrupt thaw of permafrost has large impact on future global warming
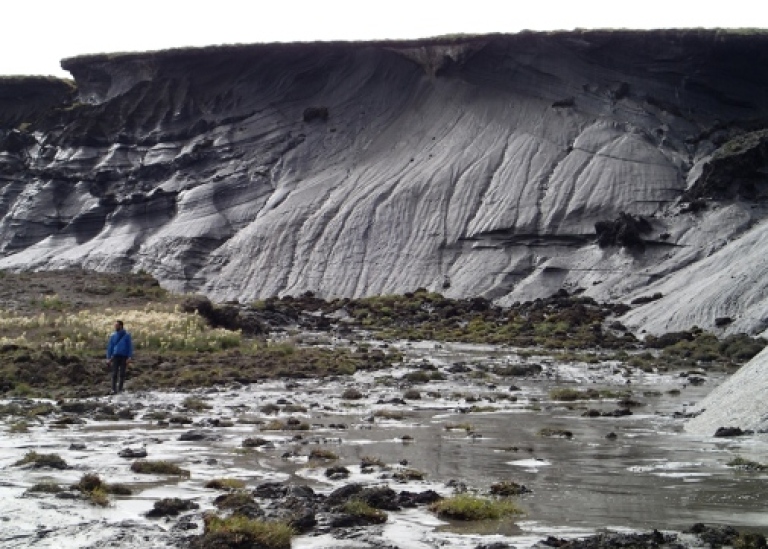
Permafrost is one of Earth’s largest terrestrial carbon stocks. It stores around 1,500 billion tonnes of carbon, which is near twice the amount of carbon in the atmosphere. But rising temperatures cause permafrost thaw and ground surface collapse, leaving behind dramatic changes in the landscape. In a study that was selected one of the most important insights in climate science 2020, Bolin Centre researcher Gustaf Hugelius and colleagues shows that the emissions of greenhouse gases from permafrost will be larger than earlier projections because of abrupt thaw processes affecting frozen peatlands, which are not yet included in global climate models.
Peatlands are areas with constant waterlogged conditions that slow plant decomposition, allowing dead plant remains to accumulate as peat. This process has produced one of the largest natural carbon stores on land. Now, nearly half of northern peatlands are affected by permafrost, meaning that they are perennially frozen and that the peat is protected from decomposing organisms such as bacteria and fungi. If abrupt thaw of this permafrost occurs, that could shift the entire northern hemisphere peatland carbon sink into a net source of global warming, dominated by methane and lasting several centuries.
Despite their importance to the global climate, peatlands remain poorly mapped, and the vulnerability of permafrost peatlands to warming is uncertain. Until now.
“Our study compiles over 7,000 field observations to present a data-driven map of northern peatlands and their carbon and nitrogen stocks. We use these maps to model the impact of permafrost thaw on peatlands and find that warming will likely shift the greenhouse gas balance of northern peatlands. At present, peatlands cool the climate, but anthropogenic warming can shift them into a net source of warming,” says Gustaf Hugelius.
Permafrost is a key factor in climate change. In the Arctic, it covers the area of three times the size of EU, and if it thaws, vast amounts of CO2 and methane would be released. Those emissions are largely not included in the IPCC climate change projections that the Paris agreement rests on.
Certain emissions are included in more recent studies, but up until now no models have included abrupt thaw processes, so called thermokarst, when the ground quickly collapses and exposes deep layers of permafrost. During 2020, calculations of the effects they are causing was presented for the first time.
“If we include the emissions from the abrupt thaw and thermokarst, the total warming from permafrost in the next hundred years will be almost doubled compared to what have been prognosed earlier,” says Gustaf Hugelius.
The new finding has major implications for how fast emissions on Earth must be reduced. The human remaining CO2 budget is a concept that is used to illustrate how large emissions of greenhouse gases can be allowed to meet the goals of the Paris agreement. If the new findings from emission from permafrost are included, the CO2 budget is radically changed.
“The permafrost alone eats up one third of the budget we have left, in order to stay below 1.5 degrees warming. I hope that the new calculations can be used as an argument to show the importance of acting quick,” says Gustaf Hugelius.
“When the ice in the ground melts and drains away, it is forever lost. The permafrost ice has formed during hundreds of thousands of years, and when it thaws we have a new reality to face. From a human perspective, these processes are permanent,” says Gustaf Hugelius.
Included in 10 insights in climate science 2020 – a horizon scan
The article Large stocks of peatland carbon and nitrogen are vulnerable to permafrost thaw was published in PNAS on 25 August 2020 and you can access it here: https://doi.org/10.1073/pnas.1916387117.
The article was included in 10 insights in climate science 2020 – a horizon scan, which summarizes some of the most important findings within climate change-related research, published in Global Sustainability, Cambridge University Press, https://doi.org/10.1017/sus.2021.2. They summarise: “… when adding new knowledge on abrupt thaw to what’s currently modelled for gradual thaw, the expected carbon emissions from permafrost could as much as double by year 2100. The carbon emissions from permafrost regions could be even higher when including effects on root activity which increase soil decomposition. Accounting for these effects will impose tighter restrictions on the remaining anthropogenic carbon emission budgets.”

Gustaf Hugelius is Co-leader at Bolin Centre’s Research Area 4 Biogeochemical cycles and climate and works at the Department of Physical Geography, Stockholm University.
Aerosols, uncertainties and Arctic warming
Aerosols – small, invisible particles in the air around us – plays a significant role in the climate system. They affect the radiative balance of the Earth both directly, by scattering and absorbing light, and indirectly, by influencing cloud properties, which in turn influences the temperature. Aerosols can also influence remote atmospheric circulation and rainfall patterns. Currently, these aerosol interactions are one of the largest sources of uncertainty when trying to look into future climates. A team of Bolin Centre researchers at the Department of Meteorology and the Department of Environmental Sciences, Stockholm University, took a closer look at how aerosols affects the Arctic climate.
Aerosols are liquid or solid particles suspended in air, which may have adverse air quality and health impacts. Sulfate aerosols, originating from the burning of fossil fuel, also have a cooling influence on climate. In other words, they can mask some of the greenhouse gas-induced global warming.
Now, the impacts of aerosol emissions are not limited to where they are emitted. Studies using global climate models have shown that changing sulfur dioxide emissions in Europe can have significant impacts on the Arctic climate. This new study investigates more precisely how this is happening.
During the past 40 years, there has been two distinct patterns of global anthropogenic aerosol emission changes; the reduction in emissions from Europe and North America and the increase in emissions from East and South Asia. Several studies have shown that emissions from these regions can have remote and global climate impacts. Generally, removal of European and North American aerosols have increased regional warming and reduced Arctic sea ice. Also, when evaluating the impact of drawdown of European sulfate aerosols since the 1980s, an enhanced Arctic response has been found in modeling studies. That is, with less aerosols originating from Europe, the model result produces a warmer Arctic.
The question is how this works more in detail, what are the mechanistic reasons for this remote response? Which is most important for the aerosol-driven Arctic warming, is it processes in the ocean or processes in the atmosphere?
The researchers used the Earth system model NorESM to compare the climate response in experiments that vary which parameter is allowed to respond to aerosol changes:
- atmosphere alone
- ocean alone
- both atmosphere and ocean.
They conducted experiments with two modes of model configuration, a fully coupled model (which simulates both the ocean and the atmosphere) and a slab ocean model (which allows the user to run a full atmosphere model on top of a much simplified ocean model).
The researchers found that the atmosphere plays the primary role in driving Arctic warming in response to European aerosol reductions. Warming driven by that atmospheric pathway is partially offset by a cooling resulting from changes in ocean heat flux convergence. In both cases, a key mediator of the temperature response is changes in sea ice extent, through modifications of turbulent flux exchanges and surface temperature. The Arctic temperature response is smaller in the fully coupled experiments than the slab ocean experiments, due to the tendency in the fully coupled model to maintain Arctic sea ice and transport excess heat away from the Arctic. This suggests that a good representation of Arctic sea ice is vital for confident projections of future Arctic climate change, even for remote mid-latitude forcing changes.
What does it mean in a wider context that the atmosphere plays the primary role?
“Understanding whether the atmosphere or ocean plays a major role is important for describing causal links between mid-latitude aerosol emissions and the Arctic climate. Broadly, heat can be transported from the mid-latitudes to the poles either through the atmosphere or the ocean. Changes in atmospheric heat transport can occur over annual timescales but changes in ocean heat transport can take longer to manifest itself – possibly over decadal to centennial timescales. Therefore, if the atmosphere plays a primary role, then changes in mid-latitude aerosol emissions would affect the Arctic climate within the first few decades, rather than over a longer period of time – which would be the case if oceans played the primary role, says Srinath Krishnan, lead author of the study.” He continues: “Thus, if one was to investigate the impacts of mid-latitude aerosol emissions on Arctic sea-ice, then the timescale of change if the atmosphere plays a major role would be much quicker than if the ocean did. But a couple of important caveats here are that there are several links and feedbacks between the atmosphere and the ocean, so it is not entirely possible to treat them separately and that this result can be sensitive to the model and grid resolution used, both ocean and atmosphere.”
How can the results be used?
“If the atmosphere plays a primary role in affecting Arctic climate, as suggested here, then it is important to understand the changes within the atmosphere due to aerosol emission changes within the first 30 years. This involves running a transient simulation, or an ensemble of transient simulations, with the focus on early changes in atmospheric dynamics and teleconnections. The use of equilibrium fully coupled simulations may not fully explain the causal link between mid-latitude aerosol emissions and the Arctic”, concludes Srinath Krishnan.
The article The Roles of the Atmosphere and Ocean in Driving Arctic Warming Due to European Aerosol Reductions was published in Geophysical Research Letters on 28 March 2020, https://doi.org/10.1029/2019GL086681.

Srinath Krishnan is a Bolin Centre member and affiliated to the Department of Meteorology, Stockholm University. Presently, he works at CICERO, Center for International Climate, in Oslo.
Identifying major threats of environmental factors and climate change to biodiversity
In an effort to better predict what future environmental changes will most likely influence biodiversity, Bolin Centre researcher Johan Ehrlén and co-authors conducted a study to investigate which of multiple environmental drivers (abiotic, biotic, and/or anthropogenic) affected wild plants the most. This information can aid in identifying the major threats of environmental and climate change to biodiversity.
Hundreds of models have been developed to measure the impacts of drivers on per capita plant population growth rate, which is a metric of change in abundance of a plant over time, and ultimately determines the geographic distribution of the plant. However, no previous studies have taken advantage of this knowledge base to investigate what environmental drivers affect population growth rate the most. By figuring out which environmental drivers have the strongest impact, one can focus on those when predicting the consequences of environmental and climate change on biodiversity and designing mitigation strategies.
Ehrlén and co-authors collected data from 207 published studies, which provided them with 644 comparisons of per capita population growth rate at different levels of multiple drivers for 208 terrestrial plant species from 72 families. They classified the drivers into three main types, each having three subtypes. The first being abiotic drivers, including climate (such as temperature and precipitation) nonclimate abiotic drivers (such as pH, soil texture, and CO2 concentrations), and disturbance (like fires and hurricanes). The second being biotic drivers, including interactions with neighboring plants, natural enemies, and mutualists (e.g. pollinators). Anthropogenic drivers being the third main type, including grazing by domesticated herbivores and mowing, harvesting, and other types of land use.
No shortcuts when predicting future ecological and evolutionary response
The analysis of the best available data showed that “there is no one main type of driver (abiotic, biotic or anthropogenic) that has overwhelmingly stronger effect on plants population growth and fitness relative to the others”, according to Ehrlén and co-authors. However, they found that plant population growth rate was less sensitive to changes in biotic drivers relative to abiotic drivers, although it deserves to be examined further once more data becomes available. Additionally, the best estimates suggest that biotic changes will be more than one-half as influential as abiotic changes of the same magnitude. The results have four important ecological and evolutionary implication.
Four important ecological and evolutionary implications
First, when predicting how a plant species population growth and fitness will respond to climate change, only looking at the direct effects of changes in climatic drivers will not yield accurate prediction. This is because the effects of climate change are likely to also be indirect, e.g. acting via changes in fire frequencies and land use.
Second, there were no clear geographical patterns regarding the relative importance of different factors. For example, abiotic factors were not more important towards the poles and biotic more important towards the equator, which has been previously suggested.
Third, the strength of the impacts of anthropogenic drivers rivals abiotic and biotic drivers, which means that we must always consider the possibility that changes in land use by humans will in turn modify or even overwhelm the effects of climate change.
Fourth, the fact that no one driver type (abiotic, biotic, or anthropogenic) is overwhelmingly more influential than the other has important evolutionary implications. Because the results of this study are based on total fitness (population growth rate), they may more accurately indicate the importance of different selective agents than many previous studies that have looked only on one or a few aspects of organism performance. Another implication is that selection on traits that impacts effects of the different drivers on fitness should be substantial for all of the main driver types. Ehrlén explains: “For example, traits that reduce negative effects of climate, traits that reduce herbivory or its impacts, and traits that compensate for harvesting effects should on average experience selection strengths that do not differ greatly”.
What were your thoughts and expectations before this study? Were your
findings surprising?
“I would say that the findings of this study were not very surprising to us, but that our notion before carrying out the study was that the performance of plants, as well as other organisms, is the result of many different aspects of the environment. Perhaps the most surprising finding was that biotic interactions, e.g. in terms of competition, did not come out as more important”, says Ehrlén.
Is there a natural next step in this particular research topic? In other words, what could the next study focus on, as a continuation of this study?
“I think that a natural continuation of this study would be to try to assess how important direct vs. indirect effects of climate are. For example, it would be interesting to explore how climate affects fire frequency or competition between different plant species, and how does this in turn affect plant performance”, explains Ehrlén.
The article Biotic and anthropogenic forces rival climatic/abiotic factors in determining global plant population growth and fitness was published in the Proceedings of the National Academy of Sciences (PNAS) on January 14th, 2020, https://www.pnas.org/content/117/2/1107.

Johan Ehrlén is a professor at the Department of Ecology, Environment and Plant Sciences at Stockholm University, and is also one of the co-leaders for Research Area 8 Biodiversity and Climate at the Bolin Centre for Climate Research. His research interests pertain identifying the environmental drivers of variation in natural selection and population dynamics.
The numbers that control how bad global warming is going to be
How sensitive is the climate to carbon dioxide emissions, more precisely? Will a doubling of atmospheric carbon dioxide from preindustrial levels result in a 1.5°C or 4.5°C warmer Earth? The answer has far reaching consequences, since the uncertainty range includes both the merely troubling and the catastrophic. In 2018, 25 scientists were challenged by the World Climate Research Programme (WCRP) to narrow the climate sensitivity and three years later they presented a range between 2.6°C and 3.9°C, updating the climate sensitivity range that has been used for over 40 years.
It’s quite a challenge to try to estimate the consequences of rising greenhouse gases emissions on Earth’s temperature. What temperature will a doubling of atmospheric carbon dioxide from preindustrial levels result in? Back in 1979, climate scientists gathered in Woods Hole, Massachusetts, to come up with an answer. Informed by climate models available at that time, they produced a seminal paper known as the Charney report, predicting that the Earth would eventually warm between 1.5°C and 4.5°C. The authors did not quantify the probability that the sensitivity was inside or outside this range. Even though projections based on more recent climate models have been presented, the latest IPCC report from 2013 uses the interval 1.5–4.5°C, with an addition of a 66% chance of being within the interval. These earlier estimates were for the most part based on climate models, some of which would have trouble representing things that can be observed and therefore scientifically dissatisfying. Also, no progress had been achieved in over 40 years. To tackle this, the new WCRP study instead weighs together three independent lines of evidence.
New lines of evidence
The new narrowed bound of climate sensitivity between 2.6°C and 3.9°C is based on three lines of evidence. The first one is based on the trend of the average surface temperatures since record keeping began back in the 19th century. The average surface temperature has risen 1.1°C, and if the trend continues we would end up on the lower end of the interval. However, new studies have pointed out that the planet isn’t warming uniformly. Two examples are the eastern Pacific Ocean and Southern Ocean, which have been almost untouched by warming due to the fact that cold, deep water well up and absorb heat on these parts of the Earth. Both models and paleoclimate records suggest that these heat sinks won’t last forever. Sooner or later, also these waters will warm, giving rise to cloud formations that will trap more heat. As a result, the lower end of the interval has to be adjusted upwards.
The second line of evidence rests on climate feedbacks mechanisms. One of them – clouds – can either cool (through reflecting sunlight) or warm (through trapping heat) the Earth. But it has been unclear whether the total contribution from cloud changes in a warming climate is a positive or negative one. Thanks to new data from satellites, monitoring and field campaigns and also detailed computer simulations of individual clouds, the picture clarifies. “There’s a growing consensus that the cloud feedback is positive, but not super-large,” says Thorsten Mauritsen, co-leader for RA1 and one of the authors of the article.
Recent research also suggests that climate sensitivity changes over time and that it is dependent on the temperature. The research team therefore took a closer look at two states of the climate in the past, a cold period 20,000 years ago at the peak of the last ice age, and the Pliocene warm period 3 million years ago when atmospheric CO2 levels were similar to today’s levels.
The next step was to weigh together the three lines of evidence. With Bayesian statistics, a general method to weigh independent pieces of evidence, the team could produce a climate sensitivity range between 2.6°C and 3.9°C with a 66% confidence interval, matching IPCC’s traditional “likely” range.
What does it mean that the study rules out the milder levels of warming?
“Actually, the study points to climate sensitivity being moderate, neither low nor high, and the statistical uncertainty has been more than halved. This is a scientific quantum leap and all of a sudden, we have to think far more critically about evidence that challenges this new tighter range. For example, evidence from distant paleoclimates 10–15 degrees warmer than present suggest climate sensitivity could be higher, but is that a real signal or is it due to errors in the data? Or does it support theories that climate sensitivity increases with warming? The research field has become revitalized, which is fantastic”, explains Thorsten Mauritsen.
How will the new climate sensitivity estimate be used?
“The recently published United Nations IPCC sixth report on climate change uses much of the experience gained in the WCRP study, as well as new results of studies that are published in 2020”, says Thorsten Mauritsen.
The article An Assessment of Earth’s Climate Sensitivity Using Multiple Lines of Evidence was selected as a runner-up 2020 breakthrough of the year by Science. It was published in Reviews of Geophysics on 22 July 2020, https://agupubs.onlinelibrary.wiley.com/doi/full/10.1029/2019RG000678.

Thorsten Mauritsen is Co-leader at Bolin Centre’s Research Area 1 Ocean-atmosphere dynamics and climate and works at Department of Meteorology, Stockholm University. Mauritsen is active as a lead author on the recently published IPCC sixth assessment report.
Last updated: January 4, 2023
Source: Bolin Centre for Climate Research