Research highlights 2022

RT1 | Research Highlight
Investigating the impact of aerosol interactions on global climate: Why cloud effects matter
Aerosols, small particles suspended in the atmosphere, emitted by humans, tend to cool the climate. They do this directly by reflecting incoming sunlight, and indirectly by affecting cloud properties such that clouds reflect more sunlight. The scientists investigated how the global surface air temperature responds to changes in the two types of aerosol interaction with solar radiation. They found that the cloud effect causes a larger global mean temperature change than the direct effect of the aerosol particles. Interactions between aerosols and clouds are difficult to represent in climate models and are sometimes excluded entirely. These results highlight the importance of including the cloud effect to get an accurate representation of the Earth's climate.
The term aerosols refers to small particles that are suspended in the air. They occur naturally in the atmosphere but are also emitted through human activities. In the atmosphere, the aerosols interact with radiation, either directly by reflecting or absorbing sunlight, or indirectly by interacting with clouds which in turn reflect or absorb radiation. By modifying the radiation that reaches the surface, the aerosols emitted by humans affect the climate. This effect that aerosols have on the surface temperature is known as aerosol radiative forcing.
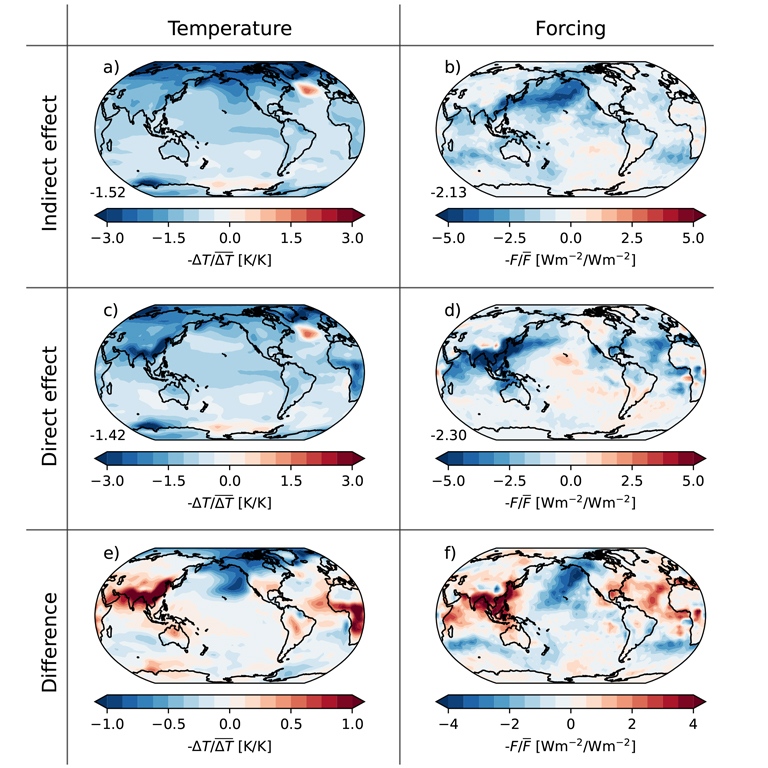
A recent study by Huusko et al. investigated the impact of the two types of aerosol interaction with solar radiation on the global surface air temperature. The researchers found that the temperature response per unit forcing is larger for aerosol-cloud interactions than for direct aerosol forcing. While direct aerosol forcing has a localised effect primarily over tropical land, aerosol-cloud interactions induce cooling over remote oceans in the extratropics. The results suggest that the spatial patterns of temperature change from direct and indirect effects of aerosols cause different forms of climate feedback.
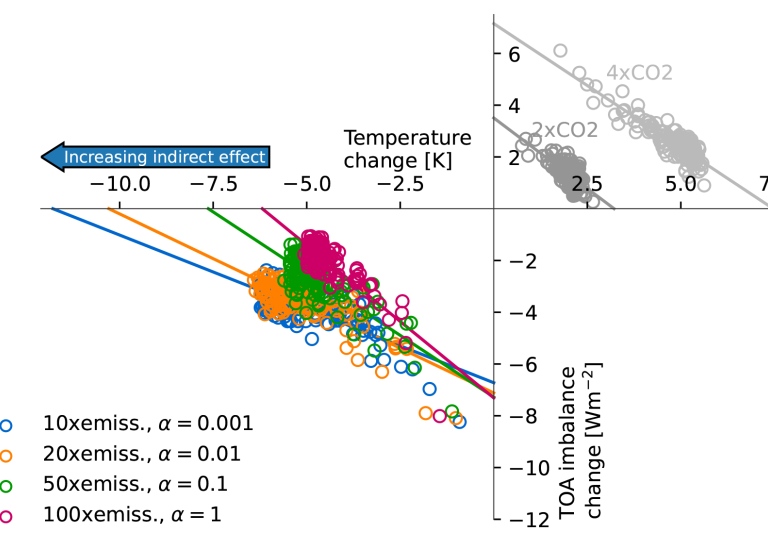
The radiative effect from anthropogenic aerosols, particularly from aerosol-cloud interactions, is the largest contributor of uncertainty to the total radiative imbalance at the top of the atmosphere, which changes the state of the climate system. Forcing efficacy, which accounts for the differences in temperature response to different types of forcing, can be incorporated into the mathematical energy balance framework that is often used to study global climate change. However, the aerosol forcing efficacy remains difficult to constrain.
The study by Huusko et al. used the Max Planck Institute for Meteorology Earth System Model version 1.2 to simulate the Twomey effect, which represents the impact of aerosol particles on cloud formation. The model's simple aerosol scheme makes it computationally lightweight and allows for systematic investigation of the climate response to aerosol forcing of different strengths. In the study, the Twomey effect was enhanced in the Earth System Model as a proxy for representing other uncertain indirect effects.
The study concludes that enhancing the indirect effect causes a larger forcing efficacy. The response to the enhanced indirect effect is dominated by remote oceans and an Arctic-amplified cooling, while the direct effect causes a radiative forcing and a resulting temperature response localised to major emission source regions. The study provides a mechanistic explanation for the enhanced remote response to the aerosol indirect effect.
The findings of this study have important implications for our understanding of the impact of aerosol interactions on global climate. By highlighting the importance of including the cloud effect in climate models and investigating the different feedback mechanisms that are affected by direct and indirect effects of aerosols, scientists can gain a more accurate understanding of how the Earth's climate responds to different pollutants.
Huusko, L., Modak, A., & Mauritsen, T. (2022). Stronger response to the aerosol indirect effect due to cooling in remote regions. Geophysical Research Letters, 49, e2022GL101184. https://doi.org/10.1029/2022GL101184
RT1 | Research Highlight
The puzzle of Earth's inter-hemispheric albedo symmetry
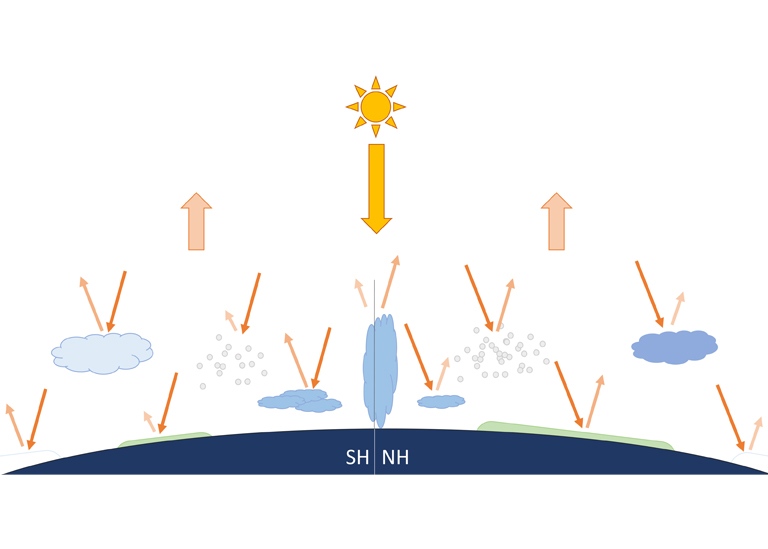
Approximately 30% of the incoming radiation from the sun is reflected back into space. The reflection, or albedo, is determined by the properties of the atmosphere and surface. The greater fraction of land surface, and larger amount of airborne particles or aerosols, in the Northern Hemisphere (NH) compared to the Southern Hemisphere (SH) would suggest that the reflection in the NH is greater. Satellite observations, however, have shown that the reflection from the two hemispheres is nearly identical. This indicates that differences in cloud cover and cloud properties between the hemispheres compensate for the clear-sky difference in reflection.

Clouds are an integral part of the climate system, regulating the Earth's temperature by reflecting incoming solar radiation but also by trapping outgoing thermal radiation. Clouds respond to changes in climate, and in turn affect the climate, and this cloud feedback is a key uncertainty in climate modelling and projection of future climate change. The framework of inter-hemispheric albedo symmetry offers an opportunity to study clouds and cloud feedback in new ways. It is not known whether the symmetry is an inherent property, so that the climate system self-regulates towards symmetry, or if it occurs by chance as a function of the current climate conditions. If there are forms of feedback that bring the system back to symmetry in response to natural climate variability, they may also give clues to feedback in response to anthropogenic forcing. Hence, by studying the albedo symmetry and how clouds at different latitudes contribute to it, in models and observations, we can learn about clouds and their interplay with climate.
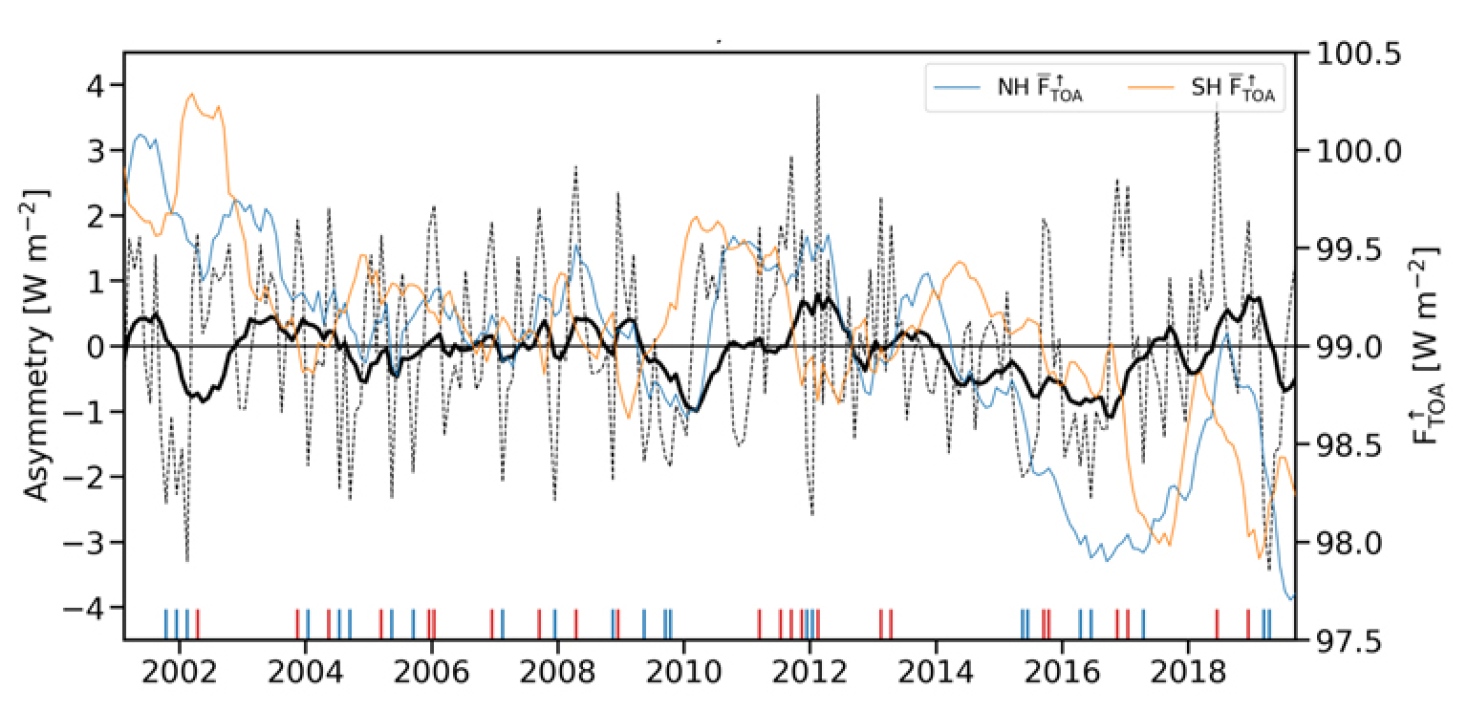
Jönsson and Bender (2022) study the inter-hemispheric albedo symmetry in observations from the satellite-borne CERES (Clouds and Earth's Radiant Energy System) instrument, which has collected data on Earth's radiation budget at the top of the atmosphere for nearly two decades. Throughout this observational record, the inter-hemispheric symmetry has persisted, within 0.1 W/m2 for the decadal mean.
The variability in symmetry is most strongly determined by variations in cloud cover at low latitudes, in the tropics and subtropics. The variations are closely related to non-neutral phases on the El Niño – Southern Oscillation (ENSO) so that cloud distribution for months when the SH is significantly brighter resembles an El Niño pattern, and cases when the NH is brighter resemble La Niña.
The observational data are also compared with climate models from the Coupled Model Intercomparison Project, Phase 6 (CMIP6). The models represent the inter-hemispheric albedo symmetry to varying degrees, and most of them underestimate the symmetry by having a brighter SH. The biases are mostly related to biases in reflected radiation in SH mid-latitudes. Models that overestimate the variability in reflection in mid-latitude clouds also overestimate the variability in albedo symmetry.
When models are forced to follow the observed historical sea surface temperature evolution, they represent the albedo symmetry better, showing that the albedo symmetry is dependent on the representation of cloud responses to coupled ocean-atmosphere processes, and that the cloud distribution follows the surface temperature pattern.
The presented paper is part of Aiden Jönsson's PhD project. He has also looked at how CMIP6 models represent albedo symmetry changes in response to strong CO2 forcing, how the symmetry in a specific model is determined by cloud parameterisations, and how high-resolution climate models represent the albedo symmetry.
Reference: Jönsson, A. R. and Bender, F. A.-M. (2022) Persistence and Variability of Earth's Inter-hemispheric Albedo Symmetry in 19 Years of CERES EBAF Observations, J. Clim., 35, 1, https://doi.org/10.1175/JCLI-D-20-0970.1.
This work has been shown in invited presentations at AGU 2021 and EGU 2022.
RT2 | Research Highlight
Understanding water storage differences in headwater and downstream wetlands for effective management and ecosystem services
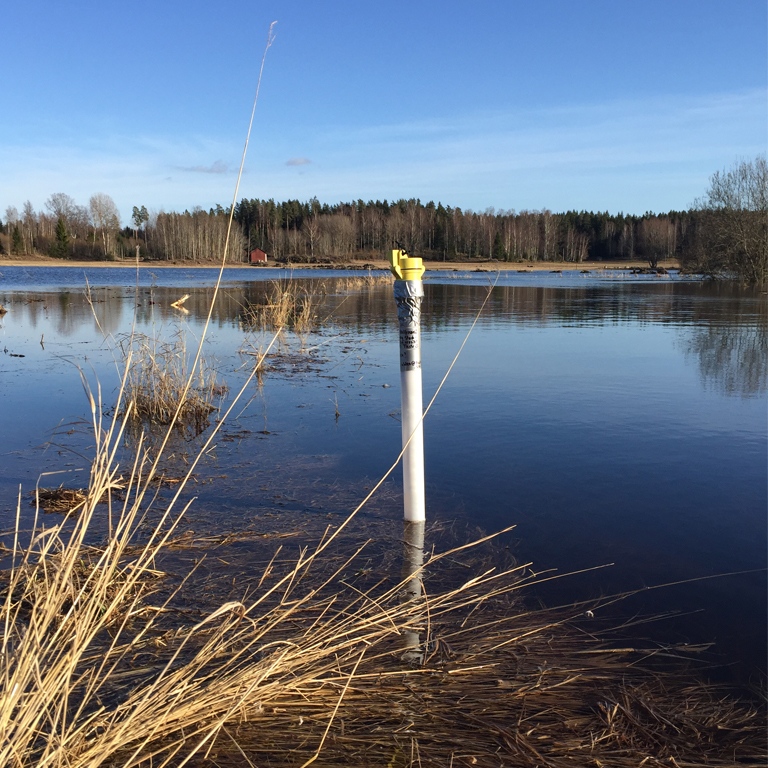
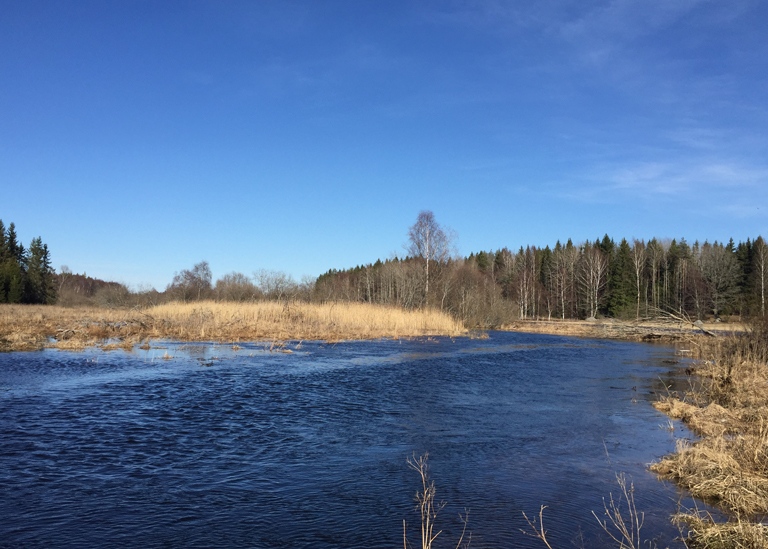
With an incredible effort of monitoring wetlands in Sweden, Åhlen et al. show that two distinct storage behaviours depend on the position of the wetland in the landscape. First, they found that wetlands located in headwater regions temporarily stored surplus water from regular summer rains. In contrast, water levels of downstream wetlands dropped to seasonal low values without responding to individual summer precipitation events. These differences between headwater-downstream wetlands imply that the functionality of an entire wetlandscape cannot be assessed by simply extrapolating data from monitoring stations that are typically located downstream of headwater regions. Understanding these differences can support wetland management practices targeting nature-based solutions and ecosystem services.
Wetlands are crucial for maintaining ecosystem balance by supporting diverse flora and fauna, buffering floods, and retaining nutrients. Specifically, many ecosystem services from wetlands are driven by wetland water storage dynamics. However, current climate and land use changes affect wetland water storage dynamics and ecological services, and thereby will also affect the capacity of wetlands to contribute to the realisation of different sustainable development goals.
Hence, the impact of large-scale processes on wetland systems involving entire landscapes needs to be better understood.
A recent study in Vattholma, Sweden, investigated water storage differences within wetlands in the same catchment. The study found that headwater wetlands had pronounced water level variations throughout summer, while downstream wetlands maintained low water level conditions. Changes in inundated wetland areas in response to water level variations were therefore considerable for headwater wetlands. Headwater wetlands were also shown to store excess water from regular summer rains, while downstream wetlands maintained their capacity to buffer extreme floods. The study implies that wetlandscape functionality cannot be assessed by monitoring stations downstream of headwater regions. It is therefore essential to understand location-specific wetland differences for effective wetland management.
The study showed that water storage dynamics in wetlands are highly dependent on their location within the landscape. Headwater wetlands rapidly filled during regular precipitation events and had reduced capacity for buffering larger volumes of water during extreme events. Downstream wetlands maintained a large buffering capacity for future extreme flood events. This has implications for wetland use in nature-based solutions and ecosystem service delivery. Therefore, high-resolution monitoring of multiple wetlands in a catchment is crucial for understanding both large-scale (wetlandscape scale) and local-scale hydrological dynamics of wetlands.
The article Wetland position in the landscape: Impact on water storage and flood buffering was published in Ecohydrology, 2022. Åhlén, I., Thorslund, J., Hambäck, P., Destouni, G., Jarsjö, J. doi: https://doi.org/10.1002/eco.2458
RT2 | Research Highlight
The variability in methane concentrations over time and space poses a challenge to estimating emissions from vegetated coastal ecosystems
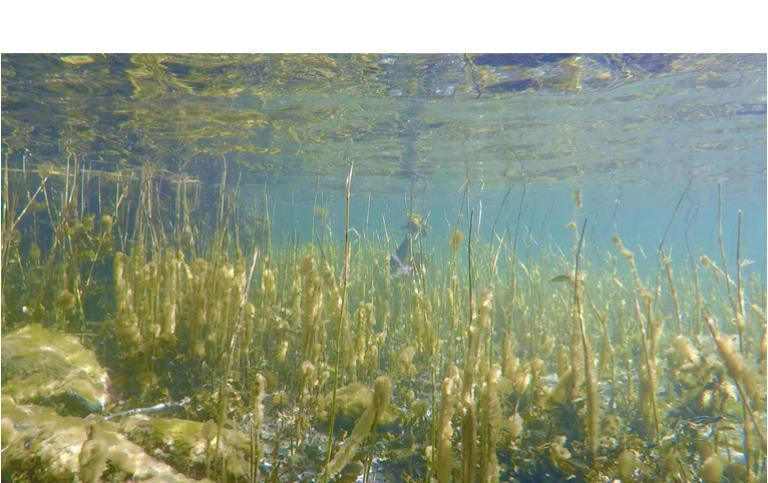
Aquatic ecosystems may account for up to half of global methane emissions from natural environments and have been proposed to drive the increase in global methane emissions over the past decade. Large uncertainties remain with respect to the global upscaling of individual measurements and matching them with model-derived emission assessments. Roth et al. addressed this problem for rarely investigated shallow-water near-shore marine ecosystems in northern temperate latitudes and demonstrated that high methane emissions from these environments can offset the carbon dioxide uptake efficiency, but that flux assessments of statistical significance require at least 50 discrete measurements per day to resolve the scale and drivers of the natural variability. The study demonstrated an urgent need for further improvements of the underlying database for bottom-up scaling from rarely investigated coastal environments promoted as “blue carbon repositories”.
Coastal methane emissions are a significant factor in the global ocean methane budget and can offset the “blue carbon” storage capacity of coastal ecosystems. Despite their importance, current estimates of coastal methane emissions lack systematic, high-resolution, and long-term data, making them sensitive to statistical assumptions and uncertainties. However, the recent study conducted by Roth et al. has shed light on the variability and spatial patchiness of coastal methane emissions.
The study highlights the importance of high-resolution measurements in improving the reliability of methane estimates and identifying habitat-specific contributions to regional and global methane budgets. The researchers identified northern temperate coastal habitats with mixed vegetation and macroalgae as understudied but significant sources of atmospheric methane. The study concludes that more extensive and intensive measurements are needed to understand and confine the habitat-specific contribution to regional and global methane budgets.
Coastal marine environments are responsible for significant amounts of methane emissions, which can have negative impacts on global climate change. However, a lack of systematic, long-term measurements has made it difficult to evaluate the potential for coastal ecosystems to mitigate climate change by storing carbon. Coastal sediments are particularly prone to high methane emissions due to vegetation and organic matter accumulation. Despite this, the heterogeneous nature of coastal environments, including varying habitats and species communities, makes it difficult to measure carbon dynamics effectively.
Global estimates of coastal methane emissions primarily focus on three types of ecosystems, namely seagrasses, salt marshes and mangroves, leaving other coastal areas out of the equation. This creates a major knowledge gap in understanding the variability of methane emissions over short spatial scales, reflecting the ecosystem mosaic typical for the coastal environment. To narrow the uncertainty in the global coastal methane budget, there is a need for methodologies that can quantify natural variations arising from biotic and abiotic drivers across multiple timescales.
The study looked at three different areas along the coast of Askö Island in the Baltic Sea. The research team used a novel tool called the Water Equilibration Gas Analyzer System – short, WEGAS – to measure CH4 and CO2 in the water and air. They also used a model to estimate how much CH4 was being consumed in the water before reaching the atmosphere. The study found that CH4 levels varied between the different areas and times of the year, and that the amount of CH4 consumed by microbes in the water was different, too.

Roth et al. found that a high sampling intensity was necessary to capture the coastal CH4 variability, especially on timescales from hours to days. The researchers conducted a bootstrapping analysis on their continuous data to determine the minimum number of individual concentration samples required to obtain an accurate, representative mean dissolved CH4 concentration. They found that collecting one discrete water sample per day, which is a typical approach, results in great uncertainty and the potential to over- or underestimate the mean CH4 concentration by almost 70%. Increasing the sampling intensity to 50 samples per day narrows this uncertainty to 10%, closer to the observed true mean CH4 concentration.
In conclusion, the study reveals the surprising variability and spatial patchiness of coastal methane emissions, emphasising the importance of high-resolution measurements in improving the reliability of methane estimates and identifying habitat-specific contributions to regional and global methane budgets.
RT3 | Research Highlight
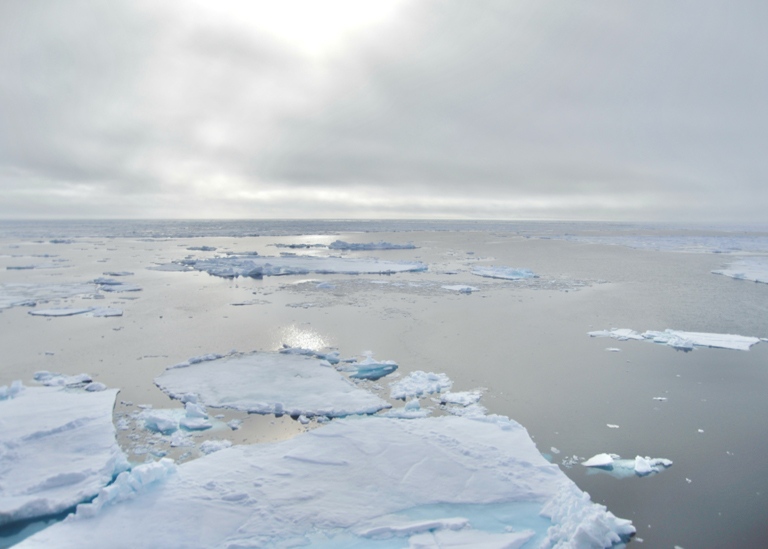
Invasion of the Arctic Ocean by Atlantic plankton species reveals a seasonally ice-free ocean during the Last Interglacial
Arctic sea ice, an important component of the Earth system, is disappearing fast under climate warming. Summer sea ice is anticipated to vanish entirely within this century. To gain a deeper understanding of the climate dynamics in a world without Arctic sea ice, researchers have turned to analogues from the geological past. The Last Interglacial (~129,000–115,000 years ago) is an interesting period to study because it is the last time in Earth's history when global average temperatures were similar or perhaps higher than currently and sea levels were considerably higher (+6 to +9 m).
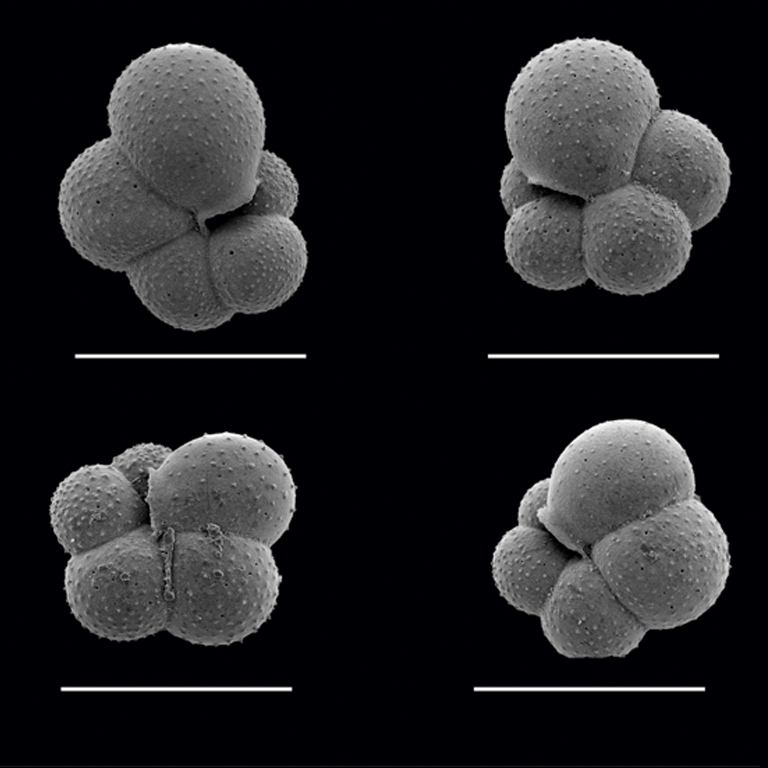
However, the extent of sea ice during this period has been intensely debated and there is no consensus, limiting understanding of this period and the ability of researchers to simulate it in climate models. To address this, a team of marine geology researchers from the Department of Marine Geological Sciences at Stockholm University analysed the microfossil content of an array of sediment cores from sites that today lie directly beneath the thickest parts of the modern Arctic ice pack. In these cores, they investigated the variability in the occurrence and composition of planktonic foraminifera, a type of free-floating, shell-building unicellular zooplankton that is sensitive to changes in oceanographic and environmental conditions.
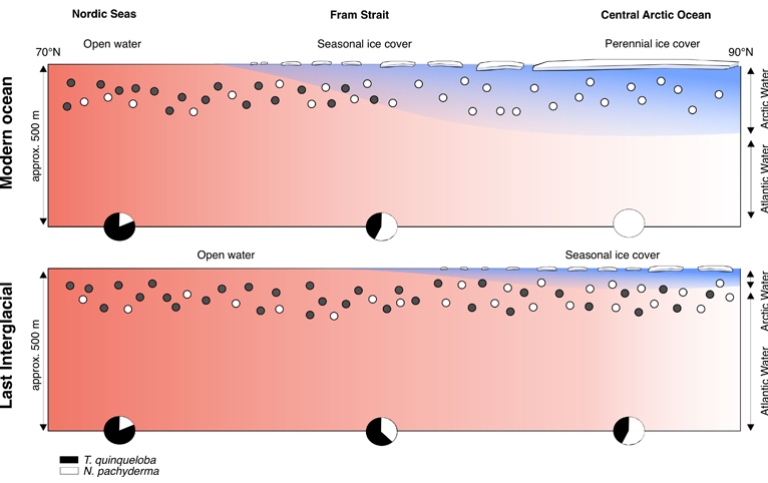
The researchers found high abundances of the typically subpolar, Atlantic-water species Turborotalita quinqueloba, documenting a large-scale expansion of the species far into the central Arctic Ocean. The ecological preference of T. quinqueloba for predominantly ice-free, seasonally productive waters typically present in the Atlantic Ocean suggests that the species was following such conditions that had spread to the central Arctic Ocean. The absence of summer sea ice and the increased influence of Atlantic currents in the Arctic domain during the Last Interglacial are analogous to ocean transformations being observed today in parts of the Arctic, and which are collectively referred to as “Atlantification” of the Arctic Ocean.
The finding that the Arctic Ocean was seasonally ice-free during the Last Interglacial is worrying because temperatures in this period would have been only around 1.5°C above pre-industrial levels, comparable to the targets of the Paris Agreement. Yet the global sea level is estimated to have been several metres higher than at present. Hence, the researchers propose the Last Interglacial as the most recent and potentially most relevant geological epoch for investigating a seasonally ice-free Arctic Ocean, particularly if the objectives of the Paris Agreement are not exceeded. To fully comprehend the physical conditions and environment of this unfamiliar Arctic during the Last Interglacial, additional quantitative proxy reconstructions of sea surface temperature and other water mass parameters are needed, along with targeted climate and oceanographic model studies of the same period.
This article is based on the the publication Vermassen, F., O’Regan, M., de Boer, A., Schenk, F., Razmjooei, M., West, G., Cronin, T. M., Jakobsson, M. and Coxall, H. K. A seasonally ice-free Arctic Ocean during the Last Interglacial. Nature Geoscience 16, 723–729 (2023), doi: 10.1038/s41561-023-01227-x
RT3 | Research Highlight
Global record of “ghost” nannofossils reveals plankton resilience to high CO2 and warming
New discoveries from the fossil record suggest that planktonic organisms, called coccolithophores, were more resilient to several past global warming events than previously thought.
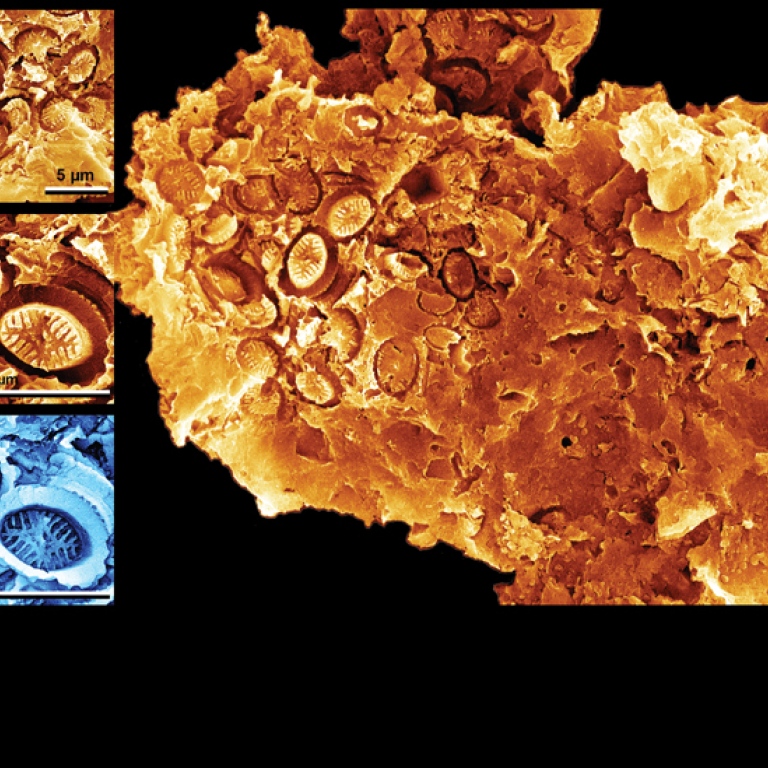
An international team of scientists, including two Bolin Centre RT3 members, Dr. Sam Slater and Prof. Vivi Vajda, from the Swedish Museum of Natural History, reported on a remarkable style of fossilisation that has remained almost entirely overlooked until now. Their findings, published in the journal Science in 2022, presented a microscopic imprint or “ghost” fossils of coccolithophores preserved in exquisite detail. Coccolithophores are a type of single-celled marine plankton that surround their cells with hard calcareous plates, called coccoliths, which are the fossil elements normally found in rocks. The ghost fossils of these coccoliths formed after they were buried within sediments on the seafloor. As more mud was gradually deposited on top, the resulting pressure squashed the coccolith plates and other organic remains together, and the hard coccoliths were pressed into the surfaces of pollen and other soft organic matter. Later, acidic waters within spaces in the rock dissolved away the coccoliths, leaving behind just their impressions – the ghosts.
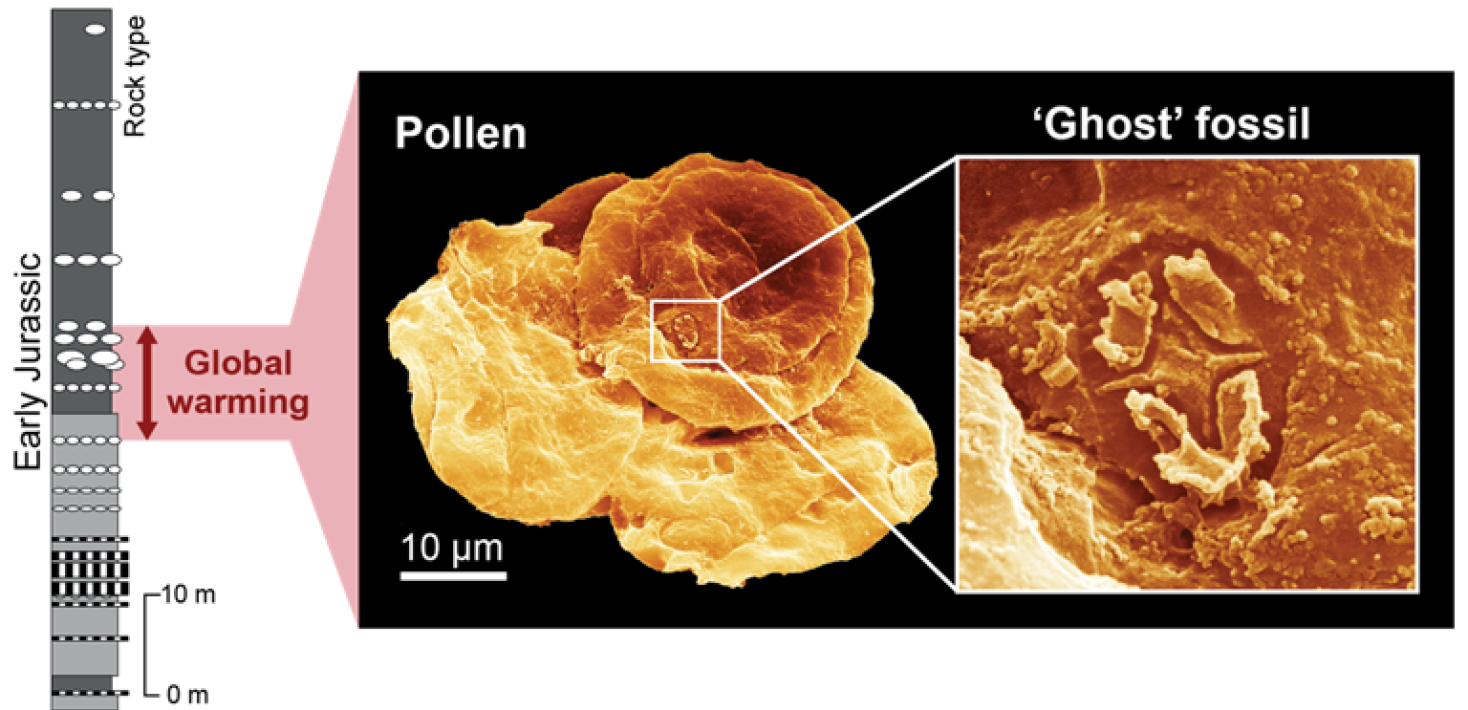
The study examined three global warming events in the deep past, in which abundance declines of coccolithophore fossils were thought to have been due to a plankton crisis caused by ocean acidification. The research focused on the Toarcian Oceanic Anoxic Event (T-OAE), an interval of rapid global warming in the Early Jurassic (183 million years ago), that was caused by an increase in atmospheric CO2 levels from massive volcanism in the Southern Hemisphere. Ghost fossils associated with the T-OAE were found from the UK, Germany, Japan and New Zealand, but also from two similar events in the Cretaceous: Oceanic Anoxic Event 1a (120 million years ago) from Sweden, and the Oceanic Anoxic Event 2 (94 million years ago) from Italy.
The discovery of abundant and diverse ghost fossils through these events thus suggests that coccolithophores were probably thriving, rather than experiencing a crisis. Despite their apparent resilience, the researchers state that coccolithophore blooms, which occur in modern oceans, may have been widespread during these past events, contributing to the expansion of seafloor “dead zones”, regions where oxygen levels were too low for most species to survive.
The findings of this study offer new avenues of research into the mechanisms that allow certain organisms to survive under changing environmental conditions, and the discovery of this unusual and cryptic style of fossilisation is changing our understanding of how plankton in the oceans is affected by climate change.
S.M. Slater, P. Bown, R.J. Twitchett, S. Danise, V. Vajda. Global record of “ghost” nannofossils reveals plankton resilience to high CO2 and warming. Science 376, 853–856 (2022). doi:10.1126/science.abm7330
RT4 | Research Highlight
The wall brown butterfly adapts to life in the north: A story of rapid evolution
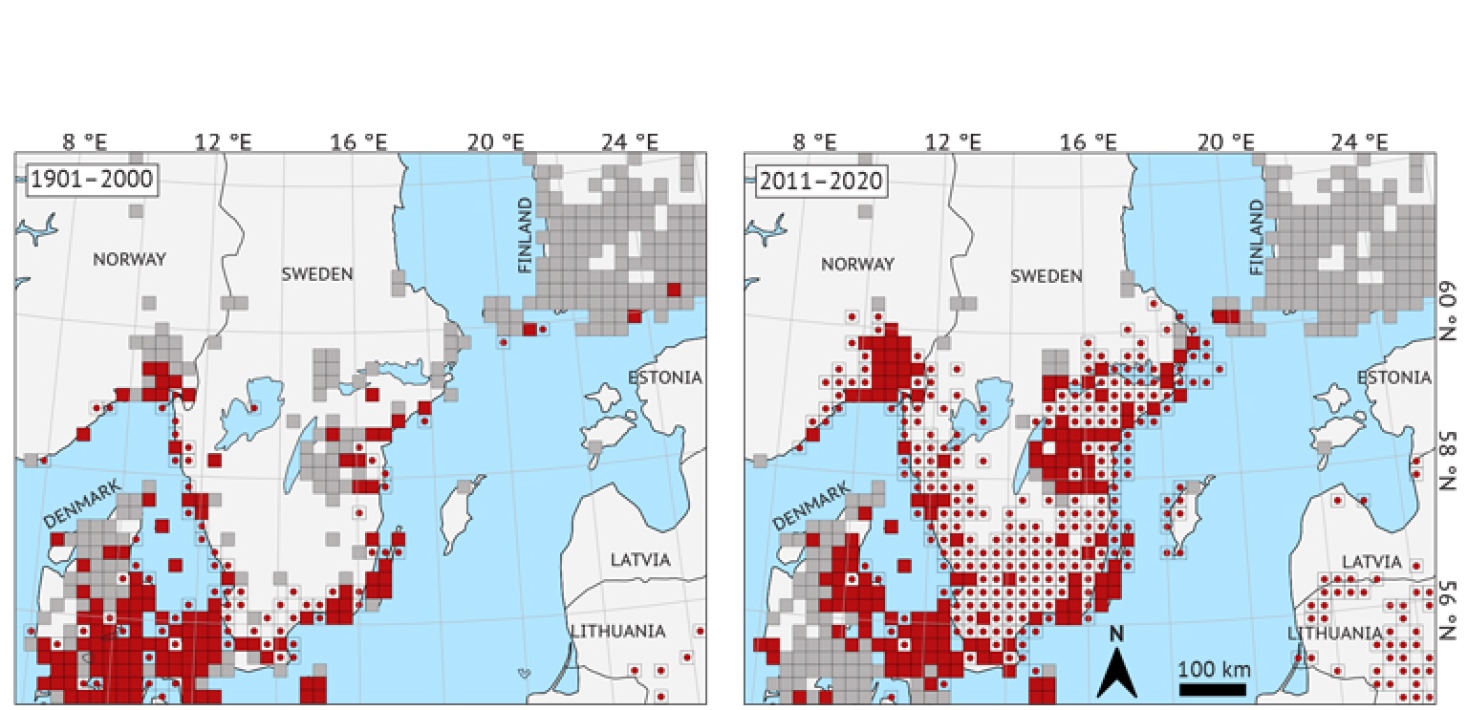
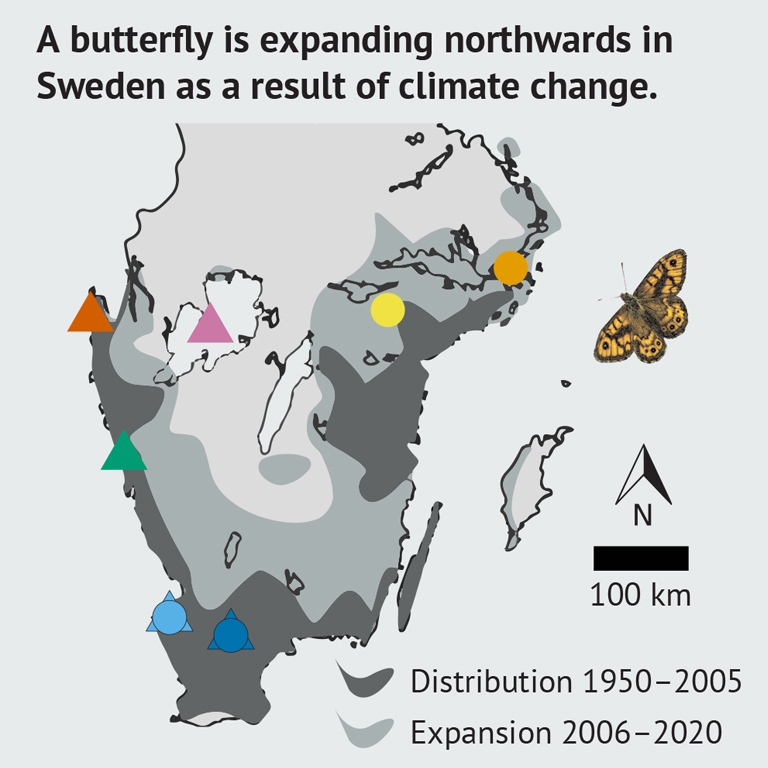
Climate change pushes species distributions towards the poles. In Scandinavia, the wall brown butterfly (Lasiommata megera) used to live mainly in Denmark and along the southernmost coasts of Sweden but has now become established as far north as Uppland in the east, and north of Oslo in the west. But even in a warming climate, such expansion over latitudes may not be as straightforward as it seems because important environmental factors stay the same although climate change. A new study published in the journal Ecology Letters shows how the wall brown has evolved to cope with the longer late-summer days of the north, a crucial adaptation because butterflies use annual cycles in day length as a calendar to time their hibernation
In laboratory experiments, the Bolin Centre's researchers found that larvae from northern populations are, compared to those from more southern populations, well adapted to northern day lengths. This evolutionary change probably occurred during the last 20 years, when the species expanded northwards. The ability to adapt to longer day lengths is important because wall browns, like many insect species, use day length to determine what time of year it is. Failure to adapt could limit the spread of these species, especially as they shift over latitudes, which differ in seasonal day length cycles.

The rapid evolution in the wall brown suggests that day length does not strongly limit insects' climate-driven poleward shifts. If such rapid evolvability is general, it would benefit both much-loved butterflies and pest insects. This is an important finding as the climate continues to change and temperatures increase, facilitating shifts in the distribution of numerous insect species.
While the wall brown benefits from warmer climates in Sweden and Norway, it has declined sharply in Western Europe. It has been suggested that the faster growth of caterpillars in warmer climates leads to western-European wall browns attempting a third annual generation of adult butterflies, for which the growth season is too short. Wall browns overwinter as caterpillars, and the last offspring of the summer must be large enough to survive the winter.
This highlights the complex and often unpredictable impacts that climate change can have on different species and ecosystems. However, the new study, showing the quick evolution of changing responses to day length in Scandinavian wall browns, gives hope for the species' western-European populations.
The study benefitted from open databases, such as the Swedish Species Observation System (Artportalen), where anyone can publish their species observations. The researchers used these citizen science databases both to analyse changes in the distribution of the species and to meet their very practical need to find butterflies to catch for the experiments. Anyone's observations can help advance our comprehension of the natural world and its rapid transformations.

In conclusion, the adaptation of the wall brown butterfly to longer day lengths in the north is a fascinating example of how species can evolve rapidly in response to climate change.
The study Local adaptation to seasonal cues at the fronts of two parallel, climate-induced butterfly range expansions was published in the journal Ecology Letters 2022. https://doi.org/10.1111/ele.14085
RT4 | Research Highlight
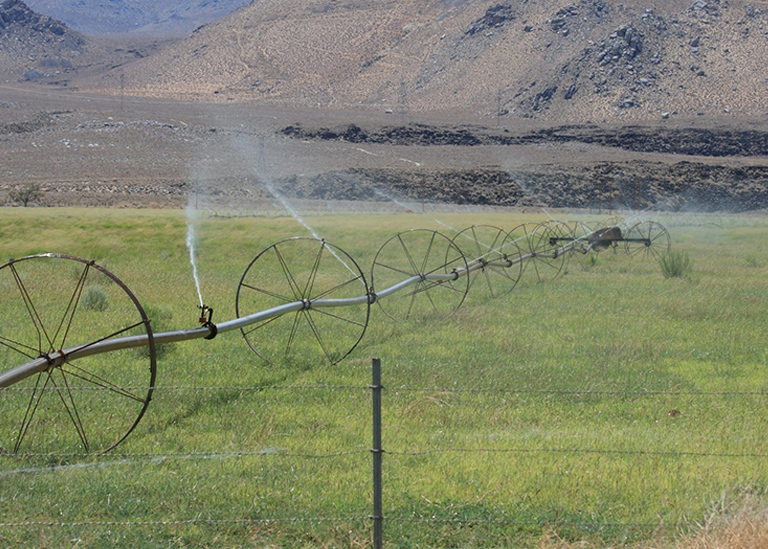
Drylands are complex ecosystems under increasing climatic and anthropogenic pressures
Drylands cover 40% of the Earth's land surface and host more than two billion people. These complex ecosystems are adapted to water scarcity, but increasing aridity and human activities are undermining drylands' ecological functioning and their ability to provide essential ecosystem services. Climate change could make matters worse, but we do not know where and to what extent. Furthermore, the degree to which ongoing and future changes in dryland vegetation will influence climate changes is not fully understood.
Predictions of dryland dynamics are difficult because, on the one hand, drylands are subjected to highly variable climatic conditions, which drive responses of vegetation and soils at multiple scales, ranging from hours to decades. On the other hand, human activities are placing pressure on dryland ecosystems via land conversion to agriculture, intensifying grazing, fire management, and redistribution of the limited water resources. Ongoing climate change is contributing to the uncertainty because various aspects of climate change are having opposite effects. In fact, warming and drying are reducing vegetation productivity, while increased atmospheric carbon dioxide is improving water-use efficiency, thus helping plants to grow better using less water. As a result, drylands are expected to expand to nearby regions due to decreasing rainfall, but some drylands where precipitation does not change much might benefit from higher atmospheric carbon dioxide— a phenomenon known as “dryland greening”, which is still debated.
While we know that plants suffer during dry periods and their productivity gradually decreases, in drylands, there can also be dramatic changes when precipitation decreases below specific thresholds. In other words, a vegetated dryland ecosystem can transition to a degraded, desert-like ecosystem that cannot sustain vegetation and associated ecosystem services. This transition can occur even after a small decrease in mean precipitation or an increase in its variability. The very cause of such dramatic change is the plants' own capacity to use limited water resources. In drylands, vegetation promotes infiltration, captures water from fog or dew, and nutrients from the atmosphere, and reduces erosion. These processes maintain vegetation in a delicate equilibrium so that even relatively small climatic changes break down the positive feedback that retains water and nutrients, resulting in a sudden transition to a less functional ecosystem. Predicting these transitions remains difficult because these processes are strongly nonlinear, meaning that even small perturbations have large and long-lasting consequences.
Not only vegetation but also soil processes in drylands rely on water and are sensitive to variations in precipitation. After dry periods, soil microorganisms are reactivated and release large amounts of carbon dioxide via respiration. These respiration “pulses” represent a significant source of carbon from drylands. At the same time, microorganisms start growing again after the dry period, which can lead to the stabilisation of carbon in soils. We still do not know how lengthening droughts is affecting these respiration and growth responses, but if respiration increases or microbial growth decreases, we expect drylands to become stronger carbon dioxide sources.
Human pressures on drylands are also increasing, partly in response to the increased population in dryland regions, and partly due to global food markets. Unfortunately, these pressures exacerbate the problems in drylands. For example, agricultural activities often require higher water withdrawals from streams and groundwater through irrigation, which can worsen the drought conditions in these regions. Additionally, increased grazing pressure drives ecosystems towards degraded states from which recovery is slow or nearly impossible under drying conditions.
To address these challenges, it is important to design holistic approaches to dryland management, accounting for the increasing climate and anthropogenic pressures, as well as the associated uncertainties in the observations and predictions of dryland productivity.

In summary, drylands are complex ecosystems facing increasing pressures from both climate change and human activities. The unpredictability of climatic conditions and nonlinear responses of vegetation and soil processes make it difficult to predict the dynamics of these ecosystems. The transition from a vegetated to a degraded ecosystem can occur suddenly, with long-lasting consequences. Drylands are also significant sources of carbon, and it is still unknown how lengthening droughts will affect microbial respiration and growth responses. Human pressures on drylands, such as agricultural activities and grazing, worsen the problems in these regions. To address these challenges, holistic approaches to dryland management that account for interactions between complex natural processes and human activities are necessary. The future of drylands and their ability to provide essential ecosystem services to billions of people depend on the effective management of these ecosystems in the face of ongoing climatic and anthropogenic pressures.
This article is based on the study: Wang L., Jiao W., MacBean N., Rulli M. C., Manzoni S., Vico G., and P. D’Odorico (2022). Dryland productivity under a changing climate. Nature Climate Change: https://doi.org/10.1038/s41558-022-01499-y
Last updated: October 8, 2023
Source: Bolin Centre for Climate Research